Conversion Intelligence
Powered by the Proxima Commerce Graph
Stop guessing what converts.
Most teams are flying blind. You’re making creative decisions based on: Your own limited performance data, pixel signals that are delayed, noisy, or incomplete and “best practices” that stopped working six months ago.
That’s not intelligence. That’s survival mode. Conversion Intelligence is about replacing guesswork with real signals before you spend, before you design, before you launch. At the center of Proxima’s Conversion Intelligence layer is the Commerce Graph.
How Conversion Intelligence Is Different from Analytics
Analytics tell you what happened.
Conversion Intelligence tells you why it happened and what to do next.
Analytics
Backward-looking
Channel-specific
Tells you results
Optimizes spend
Conversion Intelligence

Forward-looking
Market-wide
Tells you direction
Shapes strategy
What is the Proxima Commerce Graph?
The Proxima Commerce Graph is a living map of real-world shopper behavior across thousands of ecommerce brands.
It connects:
Products purchased
Seasonal buying patterns
Creative engagement
Purchase behavior
Conversion propensity
LTV across product categories and brand types
…into a single intelligence layer that shows what actually drives conversion in the market, not just on your site.
Instead of asking: “What worked for us last month?”
You can ask: “What’s working right now across brands like ours and why?”
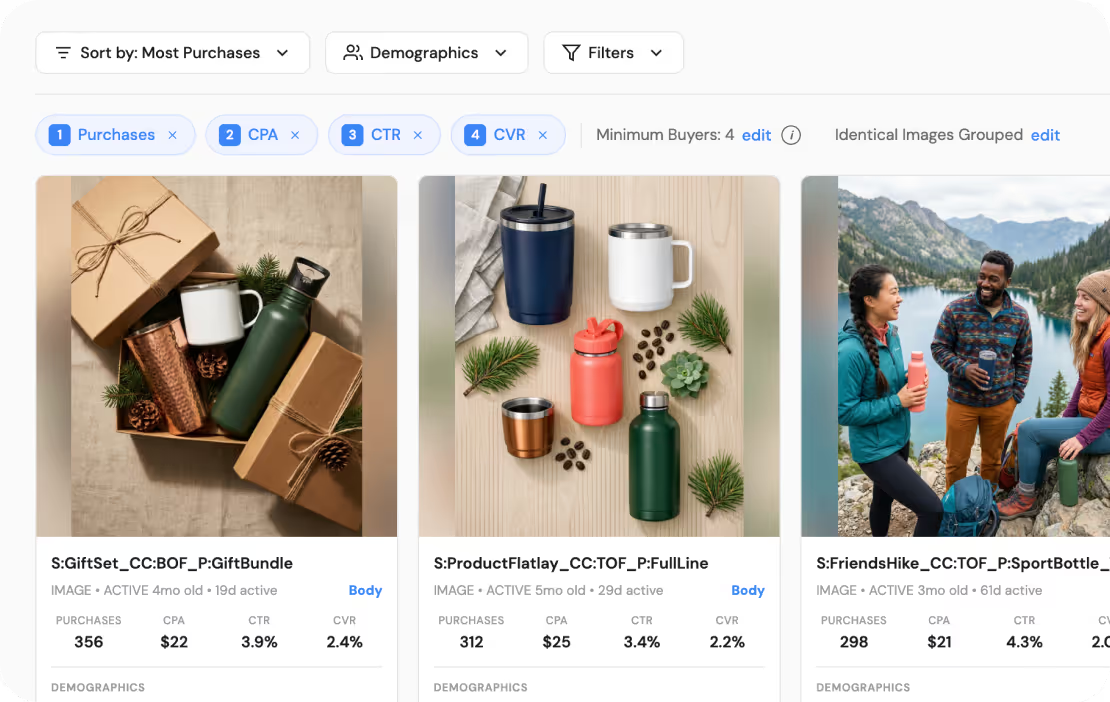
What that actually looks like in practice?
Rather than abstract insights, Proxima outputs clear, decision-ready signals inside each creative brief or report, like:
Creative Intelligence Snapshot

This ad concept is trending across peer brands in your category
January converters skew toward warm-climate regions and over-index on bohemian-chic taste profiles
Buyers of this product variant are disproportionately 50+ and respond better to lifestyle framing than feature callouts
High-LTV buyers engage more with muted color palettes and slower pacing than fast-cut UGC
This is the difference between data and direction.
Proxima doesn’t just tell you what happened, it shows you what to make next, who it’s for, and why it’s converting now.
What the Commerce Graph Is (and Isn’t)
It is:

Built on real purchase behavior, not surveys or scraped ads
Aggregated and anonymized across thousands of brands and tens of millions of buyers
Pattern-based, not anecdotal
Continuously updating as the market changes
It is not:

A vanity dashboard
A static benchmark report
Another attribution model
A creative trend gallery with no context
Why the Commerce Graph Is Valuable
Creative fails for one reason: Teams don’t know what buyers actually respond to anymore. Platforms are black boxes. Signals are delayed.
What worked last month is already saturated. The Commerce Graph gives you:
See patterns that only emerge at scale:

Which value props are gaining traction
Which creative angles are fatigued
Which product narratives convert for specific buyer types
This is intelligence you can’t get just from your own account, no matter how big it is.
Most tools optimize for specific platforms. The Commerce Graph optimizes for people, and how different buyers respond to creative. Instead of channel-level metrics, it reveals buyer-specific creative signals, including:
How different buyer types respond to creative tactics
Which creative themes over-index for specific buyer groups
How performance patterns differ by buyer type over time
What combinations of format, framing, and visual style correlate with higher conversion and LTV
That’s how teams move from aesthetic-led decisions to buyer-relevant creative strategies grounded in real market behavior.
Instead of endless testing just to learn:
You start with what’s already proven
You stop investing in repetitive and stale approaches
You focus your experiments where upside is highest
You deliver more creative, faster with 10x the hit rate

More interesting/personalized creative - lower CPMs
Less thrash. Less wasted spend. Less “why didn’t this work?”
How Teams Use the Commerce Graph
Conversion Intelligence shows up before creative is made.Teams use it to:
Decide which angles are worth pursuing
Understand what buyers care about right now
Ground creative briefs in real behavior
Align marketing, creative, and growth teams around the same signals
From Intelligence to Execution
The Commerce Graph is the Intelligence Layer. Proxima’s Execution layer turns those signals into:
Creative direction
Messaging guidance
Ad-ready concepts
Scalable outputs
Why This Matters Now
Creative has become the bottleneck. Not because teams aren’t talented but because:
The market moves faster than internal learning loops
Platforms hide signal instead of revealing it
Guessing is expensive

Build with Signal, Not Instinct
If creating ads feels harder than it should be, it’s probably because you’re missing the market context. Proxima’s Conversion Intelligence layer gives you that context, powered by the Commerce Graph. Start with intelligence. Then execute with confidence.

